Regionalization Output Plots#
Regionalization produces various plots to visualize the results from the formulation and parameter regionalization processes. They are saved in the output directory specified in the configuration file. Sample plots are shown below for a VPU (VPU 03S) in the CONUS domain. The actual plots generated will depend on the configuration settings and the data used.
Formulation Regionalization Plots#
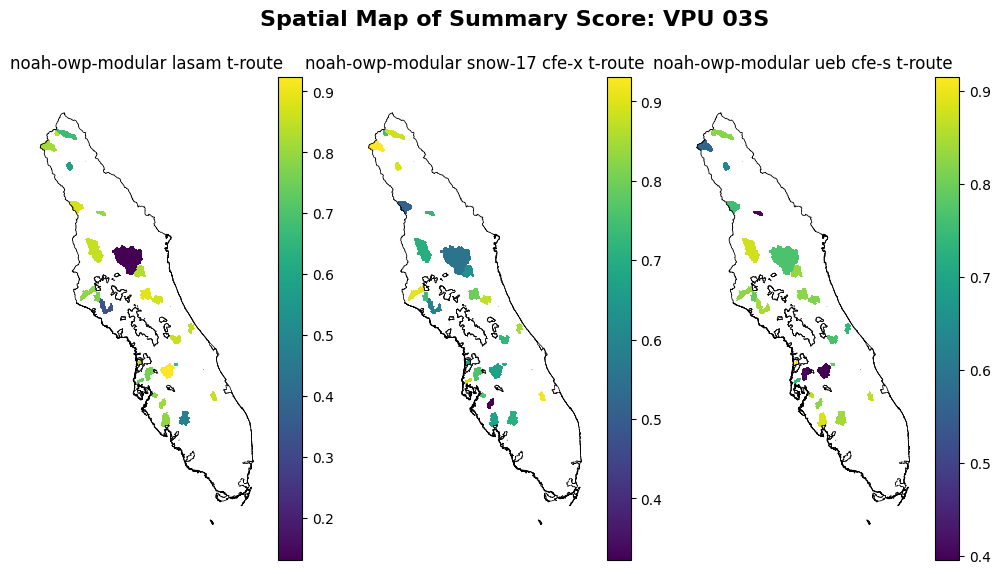
Summary Scores Map#
Description: These maps visualize the summary scores for different formulations across all calibration basins within the VPU. It helps in understanding the performance of each formulation spatially. The higher the summary score, the better the formulation performance. Plot created using data from summary_score.
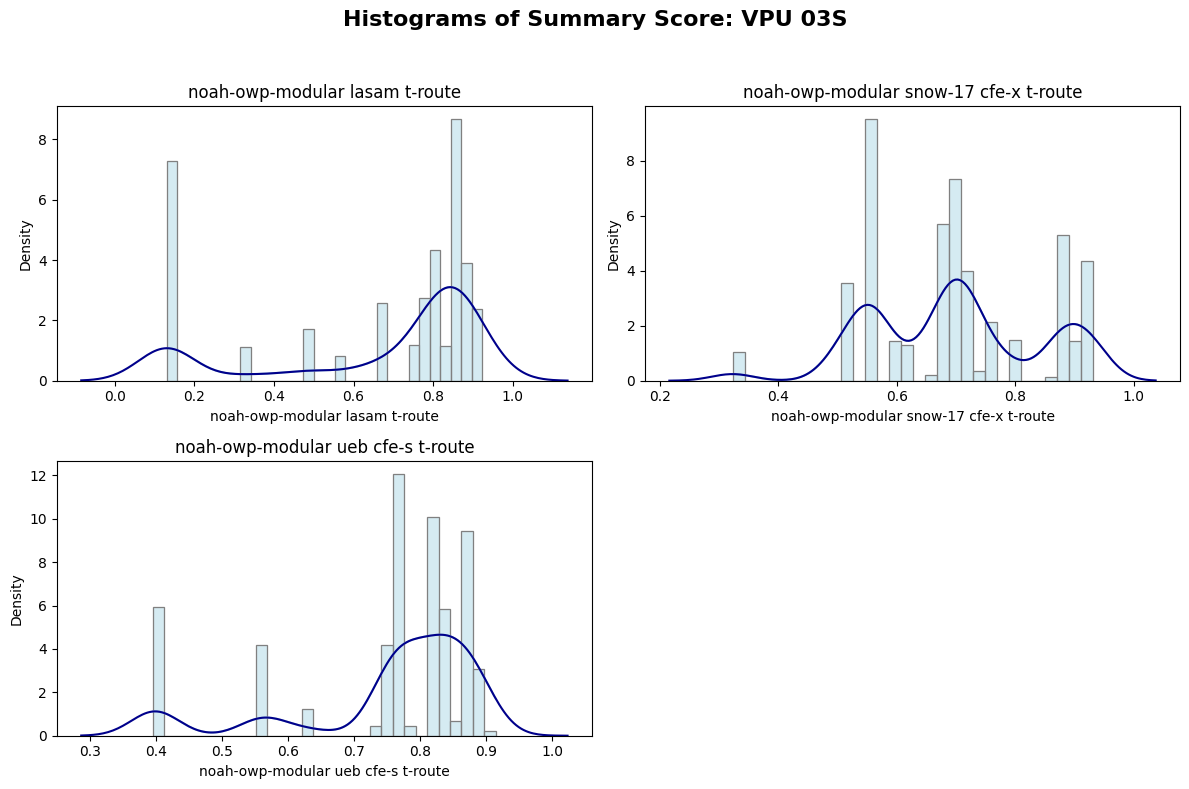
Summary Score Histogram#
Description: These histograms display the distribution of summary scores for the different formulations across all calibration basins within the VPU. It provides insights into how many basins achieved certain score ranges for each formulation. The higher the summary score, the better the formulation performance. Plot created using data from summary_score.
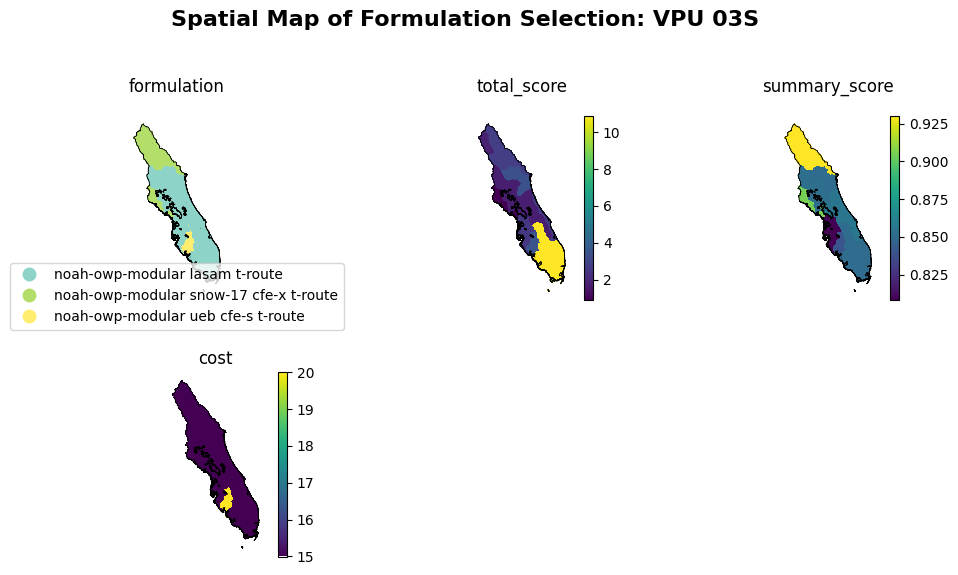
Formulation Selection Map#
Description: This first map illustrates the selected optimal formulation for each catchment within the VPU. It shows how formulations are distributed spatially after the formulation regionalization process. Maps of total score, summary score, and formulation computational cost are also shown. Plot created using data from formulations.
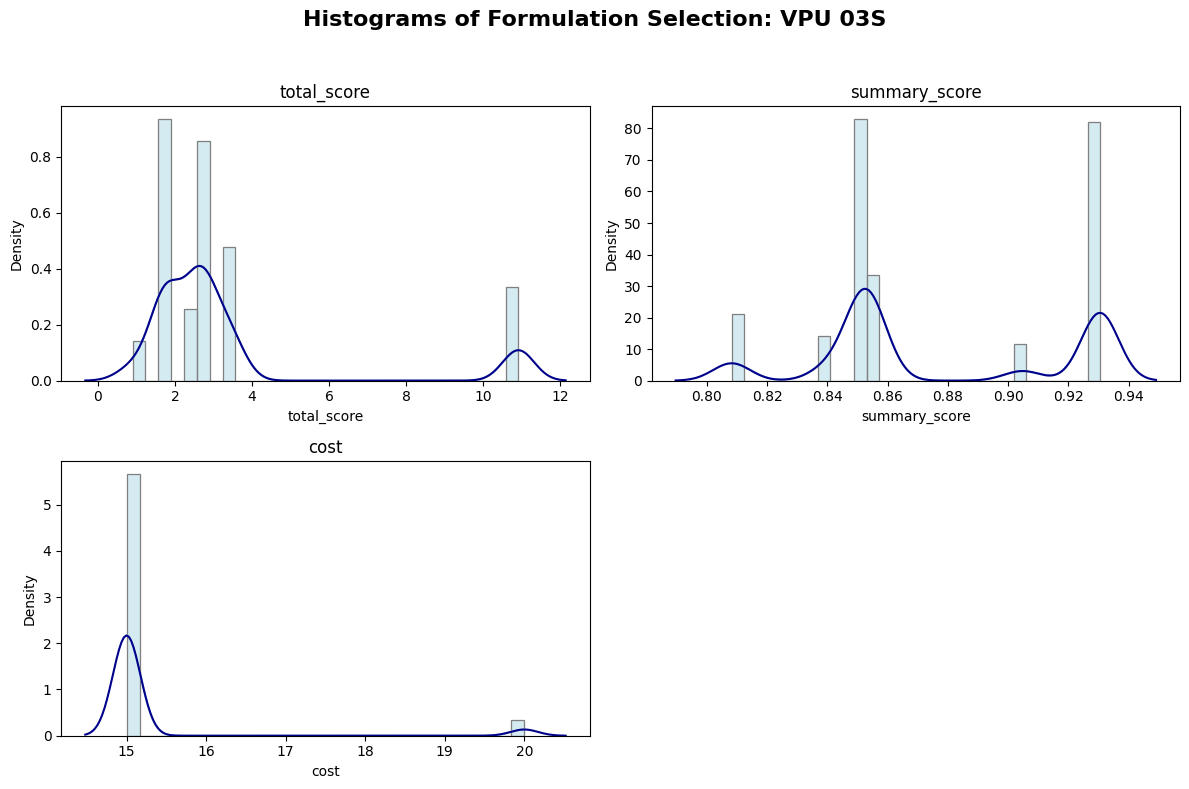
Formulation Selection Histogram#
Description: These histograms display the distribution of total score, summary score, and cost given the formulation selection across all catchments within the VPU. It provides insights into how many catchments achieved certain score or cost ranges with the VPU. Plot created using data from formulations.
Parameter Regionalization Plots#
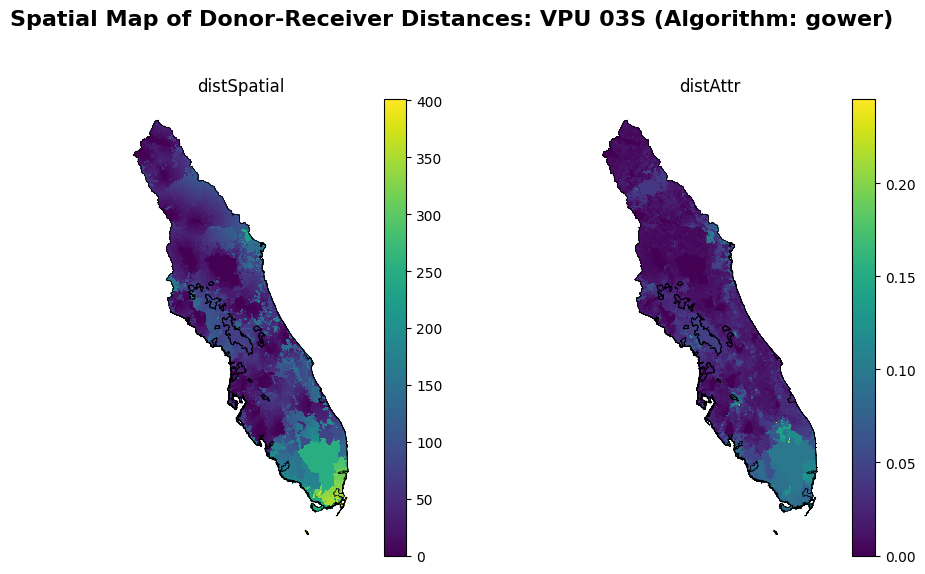
Pairs Distance Map (distance-based algorithms)#
Description: These maps display the spatial distribution of spatial and attribute distances (km and unitless, respectively) between donor and receiver catchments within the VPU. It helps in understanding how far donor catchments are, both geographyically and hydrologically, from their corresponding receiver catchments. Plot created using data from pairs_distance_algorithms. Currently supported distance-based algorithms include: gower and URF.
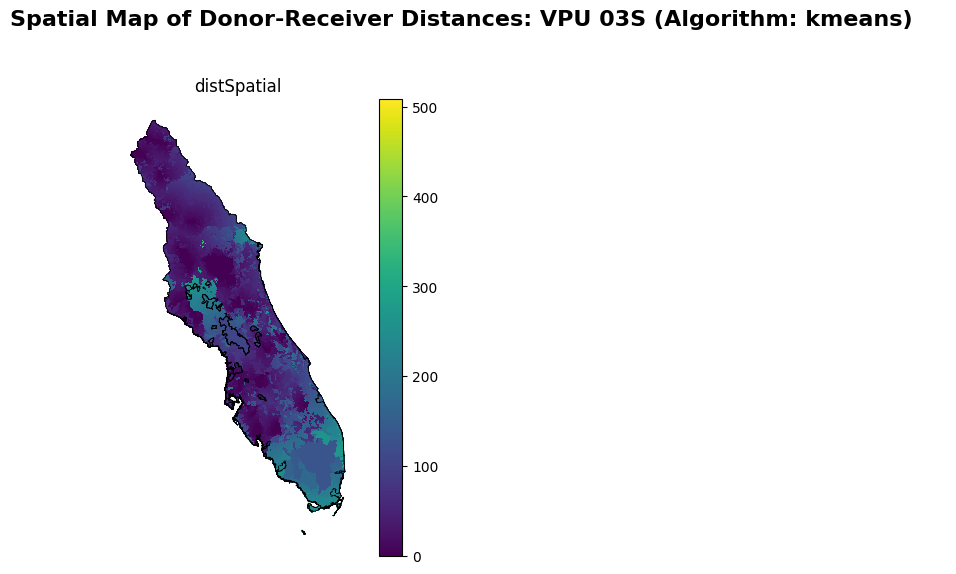
Pairs Distance Map (clustering-based algorithms)#
Description: These maps display the spatial distribution of spatial distances (km) between donor and receiver catchments within the VPU. It helps in understanding how far donor catchments are geographyically from their corresponding receiver catchments. Plot created using data from pairs_cluster_algorithms. Currently supported clustering algorithms include: KMeans, KMedoids, HDBSCAN, and BRICH. For clustering-based algorithms, only spatial distance is calculated.
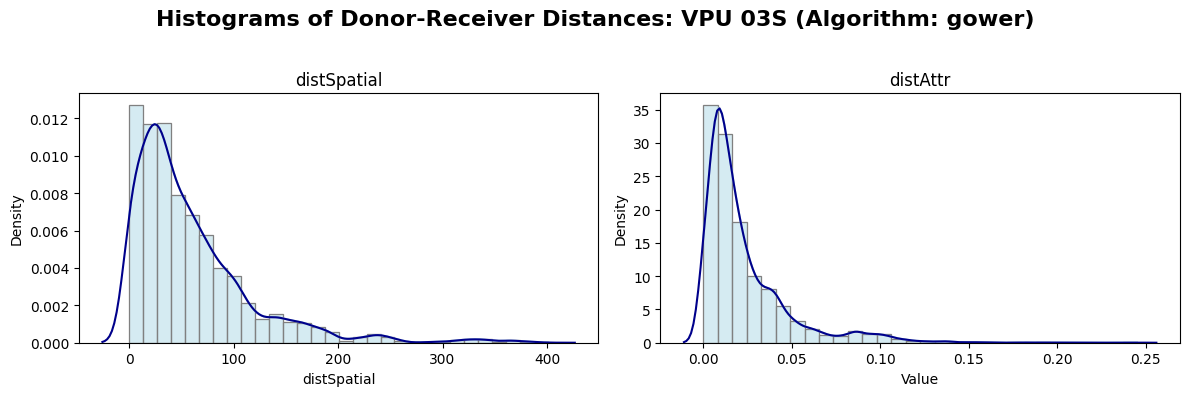
Pairs Distance Histogram (distance-based algorithms)#
Description: These histograms display the distribution of spatial and attribute distances (km and unitless, respectively) between donor and receiver catchments within the VPU. It helps in understanding how far donor catchments are, both geographyically and hydrologically, from their corresponding receiver catchments. Plot created using data from pairs_distance_algorithms. Currently supported distance-based algorithms include: gower and URF.
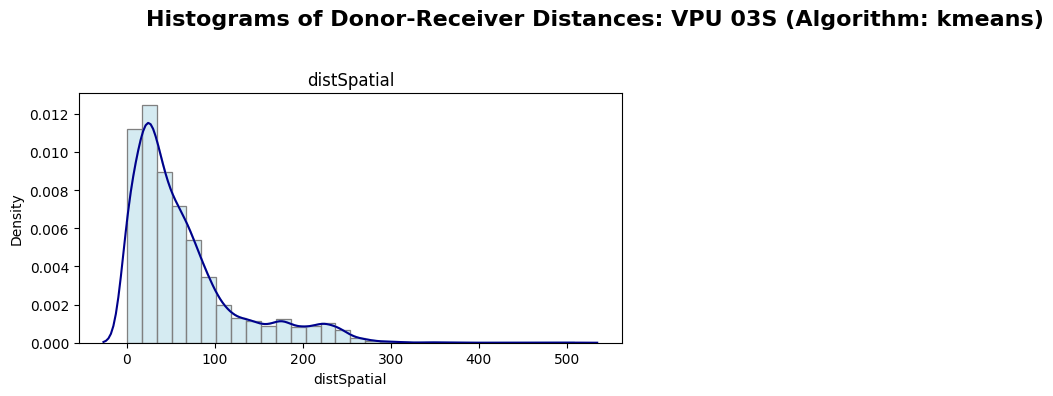
Pairs Distance Histogram (clustering-based algorithms)#
Description: These histograms display the distribution of spatial distances (km) between donor and receiver catchments within the VPU. It helps in understanding how far donor catchments are geographyically from their corresponding receiver catchments. Plot created using data from pairs_cluster_algorithms. Currently supported clustering algorithms include: KMeans, KMedoids, HDBSCAN, and BRICH. For clustering-based algorithms, only spatial distance is calculated.
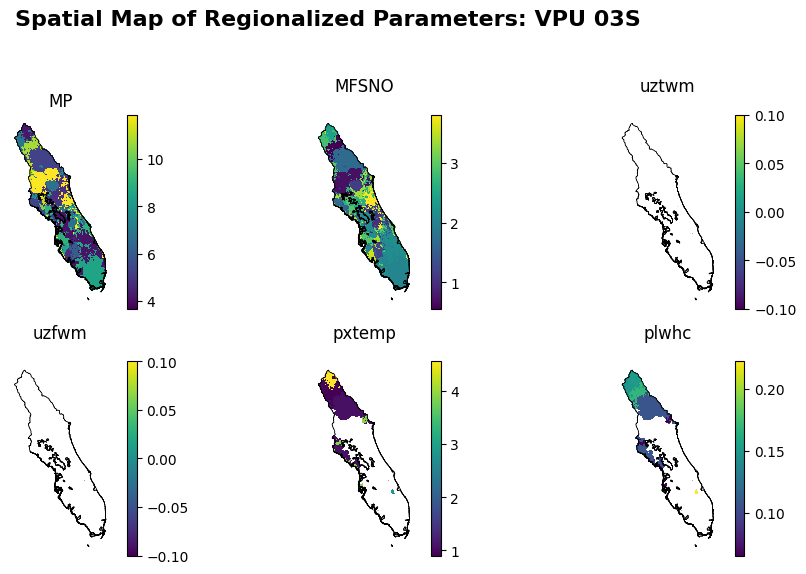
Regionalized Parameter Spatial Map#
Description: These maps display the spatial distribution of regionalized parameter values across all catchments in the VPU. It helps in understanding the spatial patterns of parameters after the regionalization process. Only parameters configured for plotting (in the output.params section of the configuration) are shown. Note there may exist spatial gaps in the maps where the corresponding parameters are not applicable to certain catchments due to the formulation chosen for those catchments. Plot is created using data from params.
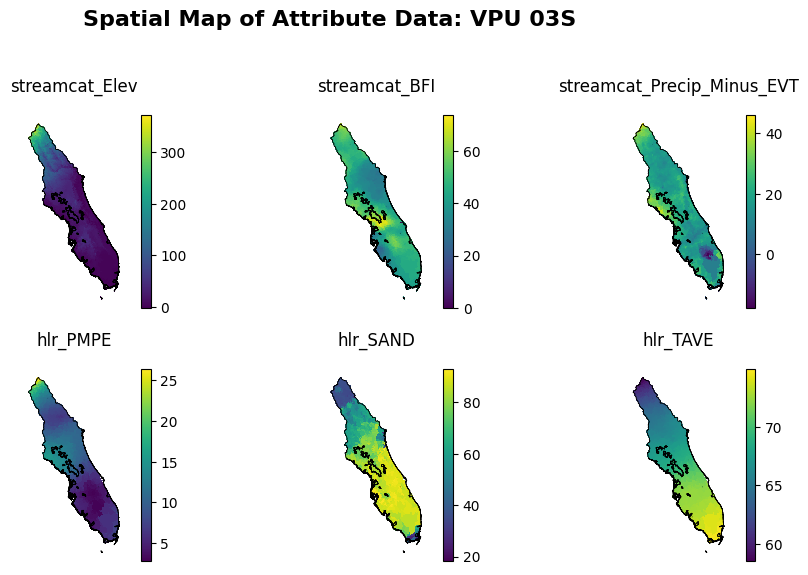
Attribute Spatial Maps#
Description: These maps display the spatial distribution of attribute values across all catchments in the VPU. It helps in understanding the variability of attributes used in parameter regionalization. Only attributes configured for plotting (in the output section of the configuration) are shown. Plot created using data from attr_data_final.
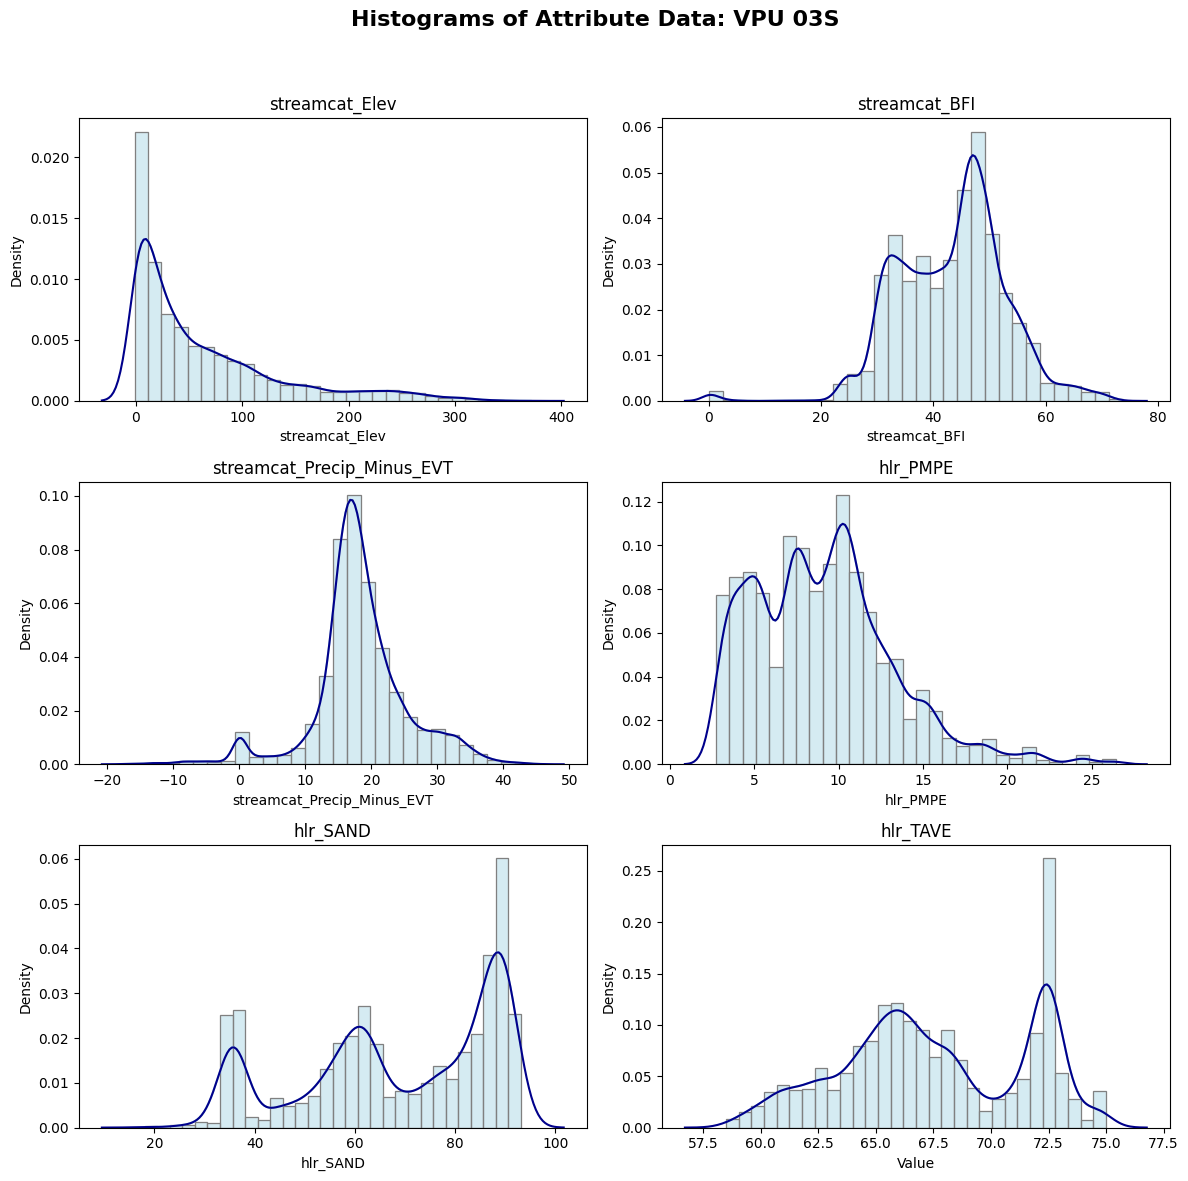
Attribute Histogram#
Description: These histograms display the distribution of attribute values across all catchments in the VPU. It helps in understanding the variability of attributes used in parameter regionalization. Only attributes configured for plotting (in the output section of the configuration) are shown. Plot created using data from attr_data_final.
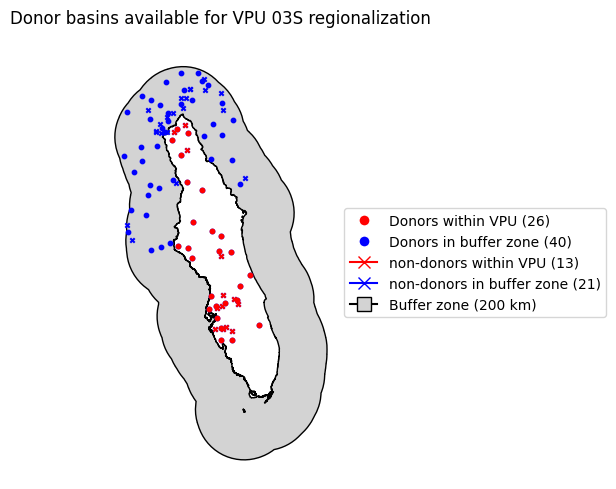
Donor Spatial Map#
Description: This map displays the spatial distribution of available calibration basins in the VPU (and with the buffer zone surrounding the VPU). Some calibration basins are not qualified as donors given the metrics screening criteria specified in the configuration.
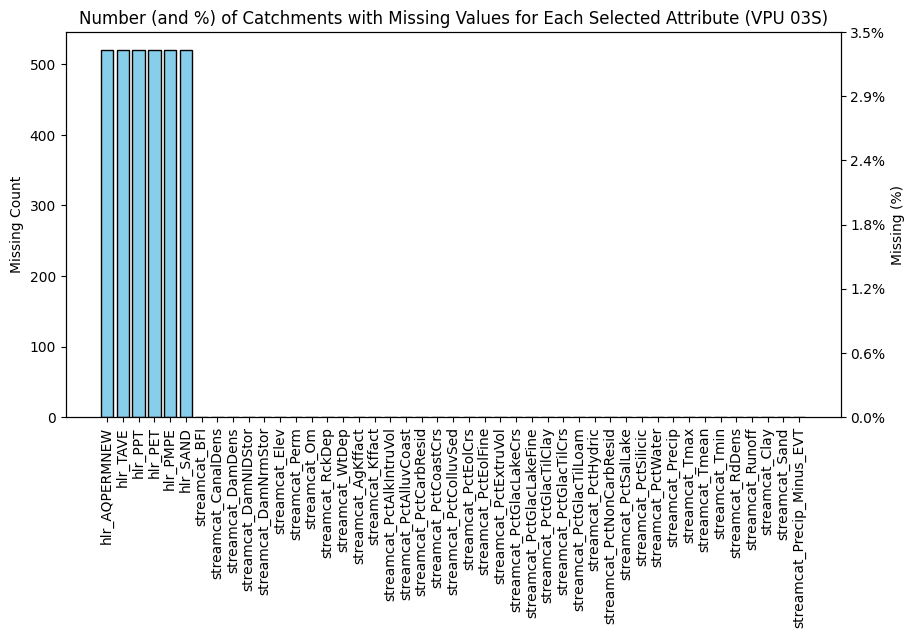
Missing Attribute Barchart#
Description: This bar chart visualizes the count of catchments in the VPU with missing attributes. It helps in understanding the data gaps that may affect parameter regionalization. Missing attributes are excluded from the parameter regionalization process for affected catchments. Plot created using data from attr_data_final.