Examples#
Two notebooks cover the client-facing surface of the library:
- Mendocino Walkthrough is the headliner — extract a SCHISM subdomain from the
Pacific mesh, drive it through the 12-stage SCHISM pipeline, derive the SFINCS AOI
from the SCHISM mesh boundary using the
nwm_coastalQGIS plugin, run SFINCS on the matching domain, then compare both models against a NOAA tide gauge and animate the two water-level fields side-by-side. - Lavaca Bay is a SFINCS-only "build from an AOI" demo on a different domain. It
covers the create + run flow with
SfincsCreatorandCoastalCalibRunner, then drives the post-processing plotting API directly (mesh inspection, flood depth map, water-surface/depth/anomaly snapshots, satellite basemap overlay, animation, and time series at user-specified observation points).
Prerequisites
Both notebooks need a compiled SFINCS executable; the walkthrough also needs SCHISM.
Both binaries are built automatically when activating a pixi environment with the
corresponding feature (schism or sfincs), so no manual build is needed in the
standard workflow. See Compiling SFINCS for build
instructions when not using pixi.
Notebooks#
-
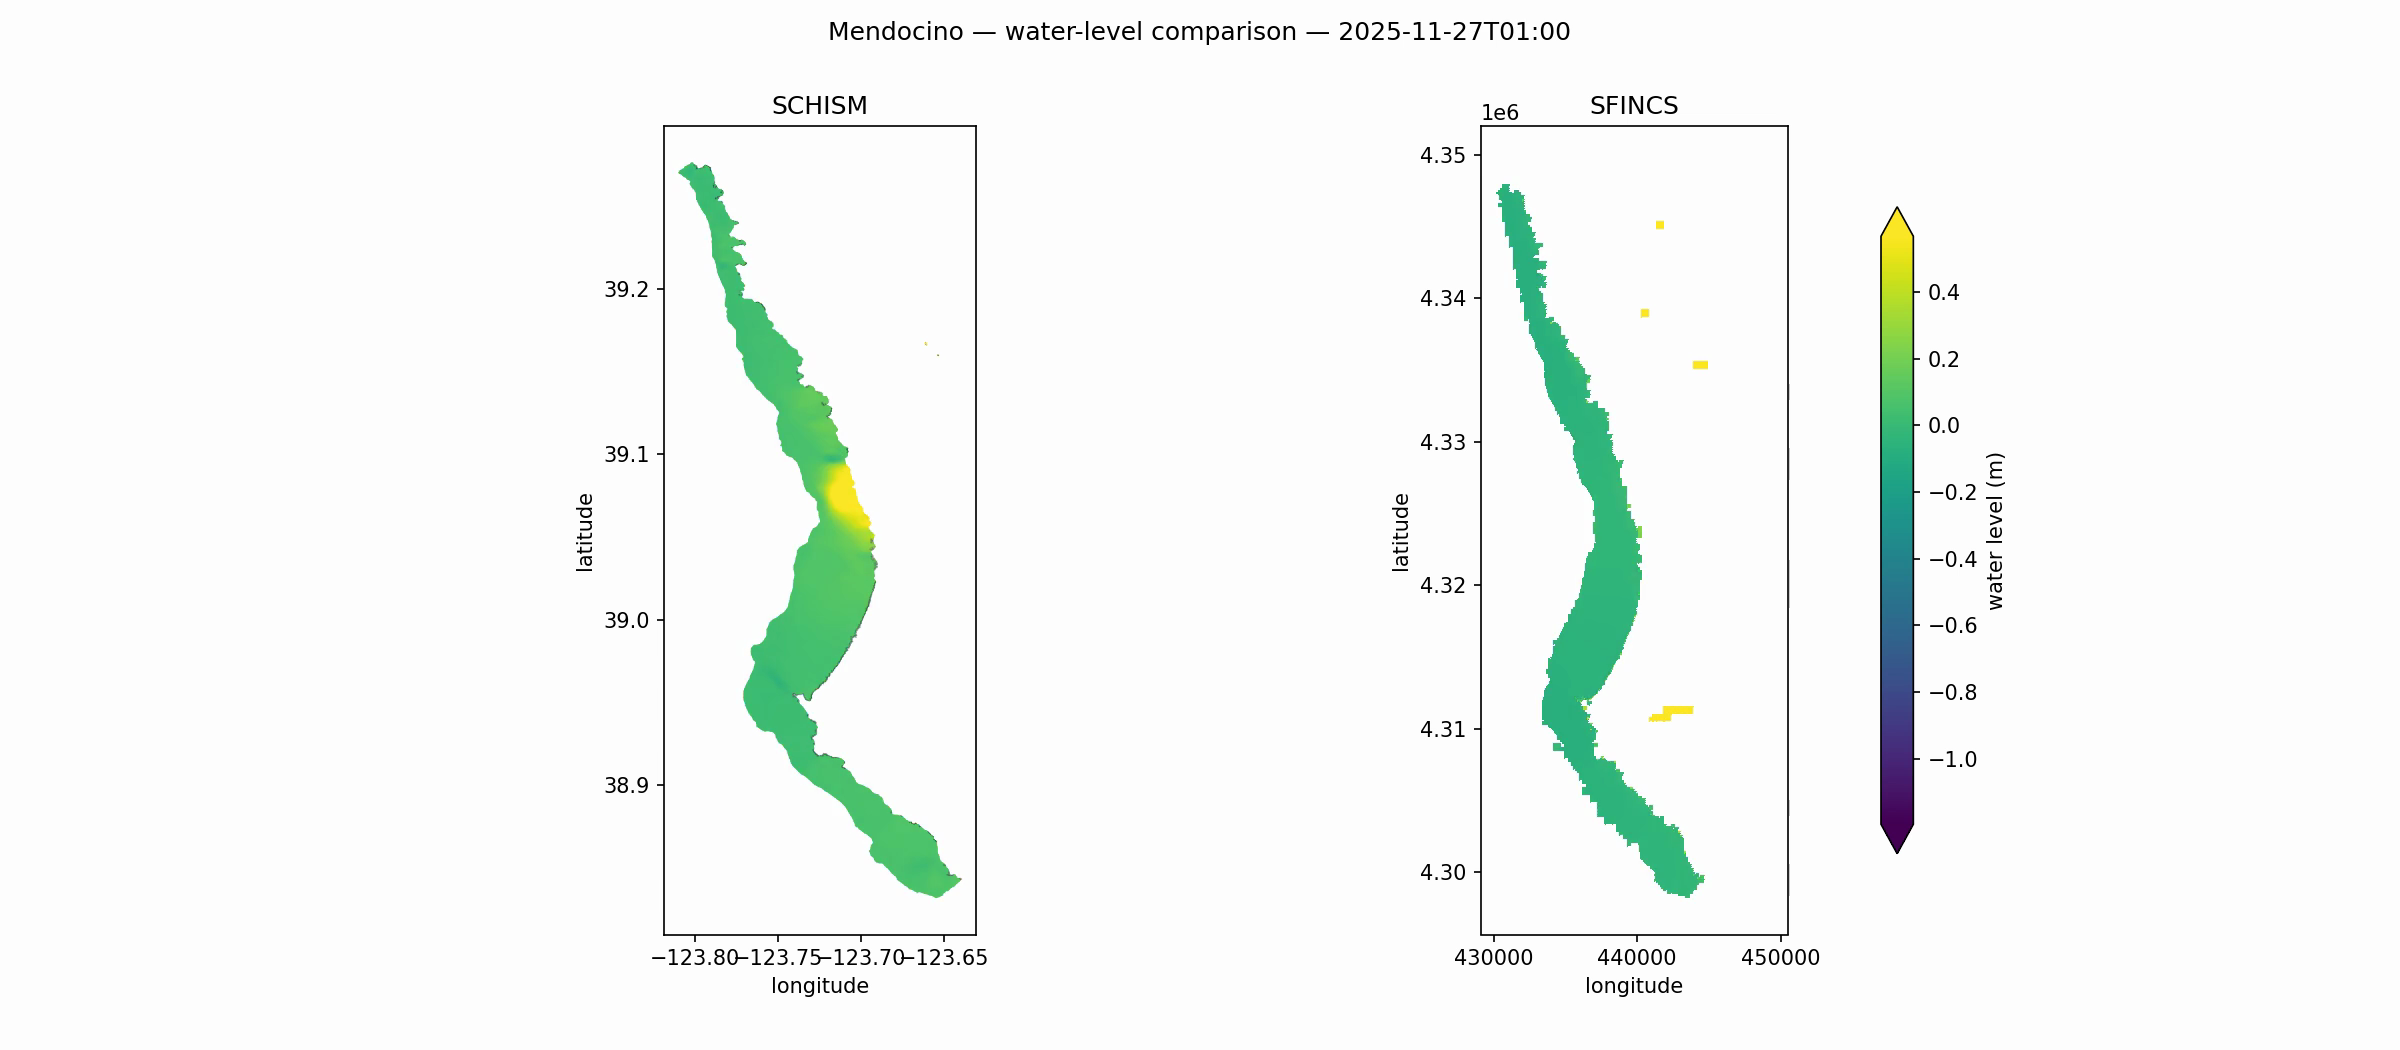 Mendocino Walkthrough (SCHISM + SFINCS)
End-to-end side-by-side demo on a single Pacific subdomain. Extract a sub-mesh from the full Pacific SCHISM domain with
extract_mesh, run a SFINCS quadtree model on the same boundary (level-4 refinement along the SCHISM mesh edge,mask.keep_largest_only, tide-stablerun_param_overrides), then compare the two against a shared NOAA gauge in a 3-line plot and render the water-level fields side-by-side with a shared colorbar viaanimate_water_level_comparison. -
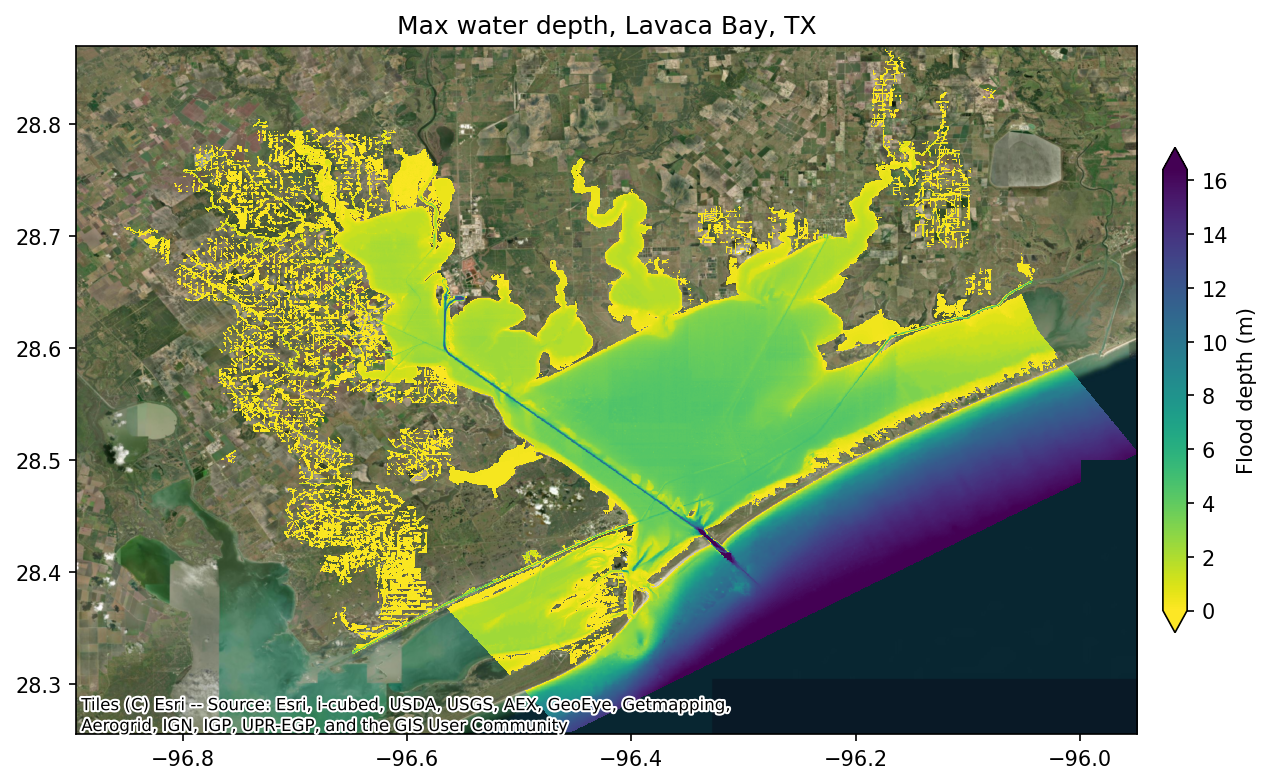 Lavaca Bay (SFINCS)
SFINCS-only build-from-AOI workflow:
SfincsCreatorproduces a quadtree mesh with elevation, subgrid, and discharge sources from a single AOI polygon, thenCoastalCalibRunnerruns the simulation and validates against NOAA observations. Drives the post-processing plotting API directly to produce mesh and flood-map inspections, water-surface/depth/anomaly snapshots, a satellite-basemap overlay, an animation, and time series at three user-specified observation points.